Confused by the Confusion Matrix?
- June 16, 2020
- Posted by: admin
- Category: AI
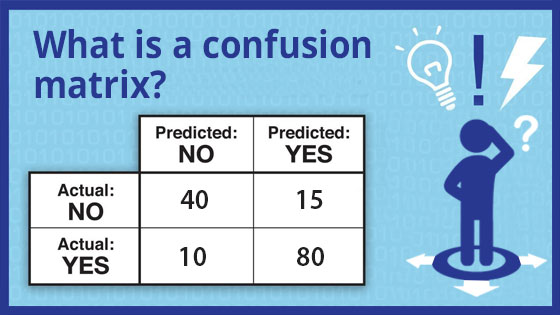
A confusion matrix is a table or report card that shows how well your classification algorithm is performing. In fact, that’s why this table is called a confusion matrix since it tells you where your algorithm got “confused” and thus needs to be improved. That’s one reason to avoid relying on just the accuracy metric since it hides details on the gap between actual and predicted values. Note that this performance metric works only with classification (e.g., logistic regression, KNN) and not regression algorithms (e.g., k-means, linear regression) or clustering algorithms.
If it’s less confusing, call this table a classification matrix.
Examples of classification problems in machine learning could both be binary (i.e., two-class) and multi-class classification problems. Examples of binary classification problems are spam filters (spam or not spam), people counters (person or not person), loan applications (approve or reject), voice assistants recognizing their wake words to start listening to your question (e.g., did you say “Google” or “giggle”) or question analysis (is the sentence a question that needs an answer or can it be ignored). Examples of multi-class classification in computer vision problems such as driverless cars could be identifying objects in an image (cat, person, car, dog, street sign, traffic lights). In fact, for driverless cars, correctly classifying objects is a mission-critical activity: you definitely don’t want it classifying a red traffic light as being a green traffic light!
For the purposes of this blog, we’re going to keep it simple and restrict our explanation to using the confusion matrix with just binary classification problems. We’ll extend it later to multi-class classification problems.
Understand the concepts
Before we get into the terminology used, let’s understand the concepts involved in the confusion matrix. If you don’t understand the differences between precision, recall and accuracy, make sure you review “The Leaky Precision-Funnel” before continuing. One of my projects involved developing a people counter classifier that we mounted at a flower store: the store owner wanted to count how many people enter and leave. However, since they were uncertain how well the people counter would perform, they asked us to quantify the performance of our classifier.
So we mounted our device on the ceiling of the shop and observed these numbers during the shop’s business hours. The way we got these numbers is by offshoring the video to some low-cost data annotators to watch the video and manually count the number of people entering the shop. That’s typically how you identify the ground truth for any classifier i.e., by sending videos or text or any raw data to annotators to manually do the classification and then compare results with the machine learning or deep learning classifier. In a future blog, I’ll show you how to do video annotations so you understand the process yourself.
For now, we want to better understand the kind of errors the classifier is making so we can focus on improving it. Digging a little deeper, your annotators annotate the videos of people entering the shop and email you the following summary:
- Actual number of people who entered shop (using human annotators) = 56
- Customers counted correctly by the classifier (and checked by annotators) = 28
- Ghosts (no one was there but the classifier still counted a person. Yes, that was weird!) = 8
- Skips (people walked in but the classifier missed them) = 5
Entering all this data into the confusion table, you get the following:
| CLASSIFIER: People Entered | CLASSIFIER: People Did Not Enter | TOTAL | |
| ACTUAL: People Entered | Agreement = 28 | Skips = 24 | 52 |
| ACTUAL : People Did Not Enter | Ghosts = 4 | does not apply | 4 |
| 32 | 24 | 56 |
Note that the scenario where both the annotators and classifier said that people did not enter is not valid for this computer vision problem. It is valid for other classification problems such as cancer detection but it doesn’t apply here. Note that it doesn’t really matter since the formula for precision and recall does not include values from this cell.
Analyze the errors from the confusion matrix
Based on the precision and recall tutorial provided in “The Leaky Precision-Recall Funnel”, the values are:
- Recall = agreement / (agreement + skips)
- Recall = 28 / (28 + 24) = 54%
- Precision = agreement / (agreement + ghosts)
- Precision = 28 / (28 + 4) = 88%
- Accuracy = agreement / total
- Accuracy = 28 / 58 = 50%
Since you don’t have a lot of time to improve your classifier, you have to decide which kind of errors to fix first. It’s obvious that recall (or how many people your classifier skipped) is low since it only counted 54% of the people who entered the stored i.e., it skipped 46% of the customers! That’s a big miss and embarrassing for your classifier.
Contrast that with precision that shows that of the people that the classifier counted, it was 88% precise. There was 12% (or four ghosts) that was mis-counted. We can always fix ghost-counting which inflated our customer count later since it’s not a major issue compared to the customers that were skipped.
As you can see, the confusion matrix is a useful tool for helping your engineers or data scientists focus on which problems to fix first.
Connect terminology to concepts
Now that you understand the concepts, let’s redo the confusion matrix but using the terminology that is normally used for machine learning and deep learning classification problems. First we define our positives and negatives.
- Positive = Customer entering shop
- Negative = Customer did not enter shop
- True Positive (TP) = Actual number of people who entered shop which the classifier agreed with = 28
- False Positive (FP) = Ghosts (no one was there but the classifier still counted a person) = 8
- False Negative (FN) = Skips (people walked in but the classifier missed them) = 5
| CLASSIFIER: Positive | CLASSIFIER: Negative | TOTAL | |
| GROUND TRUTH: Positive | TP = 28 | FN = 24 | 52 |
| GROUND TRUTH: Negative | FP = 4 | does not apply | 4 |
| 32 | 24 | 56 |
If you redo the formulas, you now have:
- Recall = TP / (TP + FN)
- Recall = 28 / (28 + 24) = 54%
- Precision = TP / (TP + FP)
- Precision = 28 / (28 + 4) = 88%
- Accuracy = TP / total
- Accuracy = 28 / 58 = 50%
Recommendation is that you validate your understanding of the confusion matrix by going through the following 2-minute practice quiz. If you truly understand it, then you should score 100%. Good luck!
Started in 2006, Inabia is HQ in Redmond, WA. Our main goal is to provide the best solution for our clients across various management and software platforms. Learn more about us at www.inabia.com. We partner with Fortune 100, medium-size and start-ups companies. We make sure our clients have access to our best-in-class project management, staffing and consulting services.
